Abstract: Hematopoiesis refers to gradual differentiation of pluripotent hematopoietic stem cell(HSC) to various progenitor cells with different proliferation and differentiation potentials. With the rapid development of multicolor flow cytometry, heterogeneity analysis for hematopoietic stem/progenitor cell(HSPC) is gradually deeper. A highly effective 14-color full spectrum flow cytometry can analyze subpopulation components of mouse HSC and HSPC, strongly supporting early research on mouse hematopoietic system.
Keywords: Heterogeneity Analysis, Full Spectrum Flow Cytometry, Hematopoiesis, HSPC, HSC
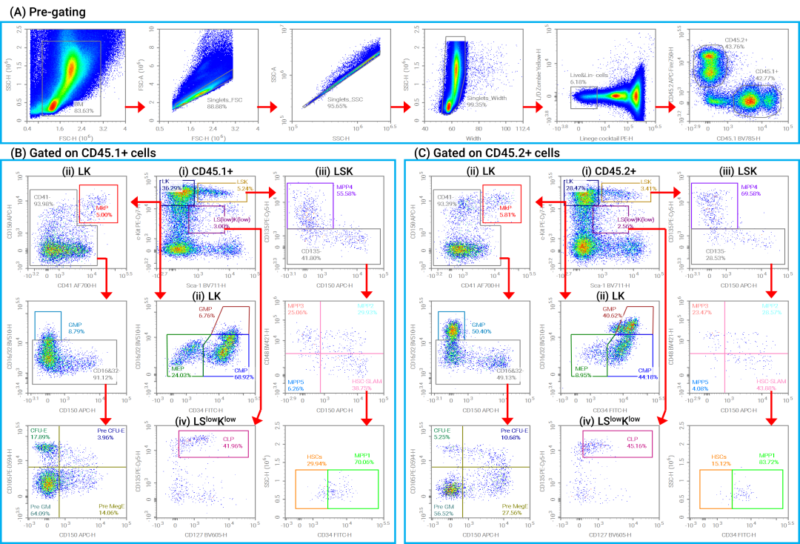
1. Manual Gating Strategy
The analytical process removes debris and adhered cells via FSC-H/A, SSC-H/A and width parameters, following living cell gating and removal of Lineage+mature cells(markers like CD3, Gr-1 etc). Distinguish expression of CD45.1 and CD45.2 in Lineage-living cells. Then, identify LK, LSK and LSlowKlow population according to expression of Sca-1 and c-Kit. Furthermore, identify CMP, GMP, MEP, MkP and each precursor cell. Distinguish HSC(CD150+CD48-CD34-CD135-) and MPP1-5 subpopulation. Identify CLP in LSlowKlow population according to CD135 and CD127. This strategy achieves multi-level and accurate grouping.
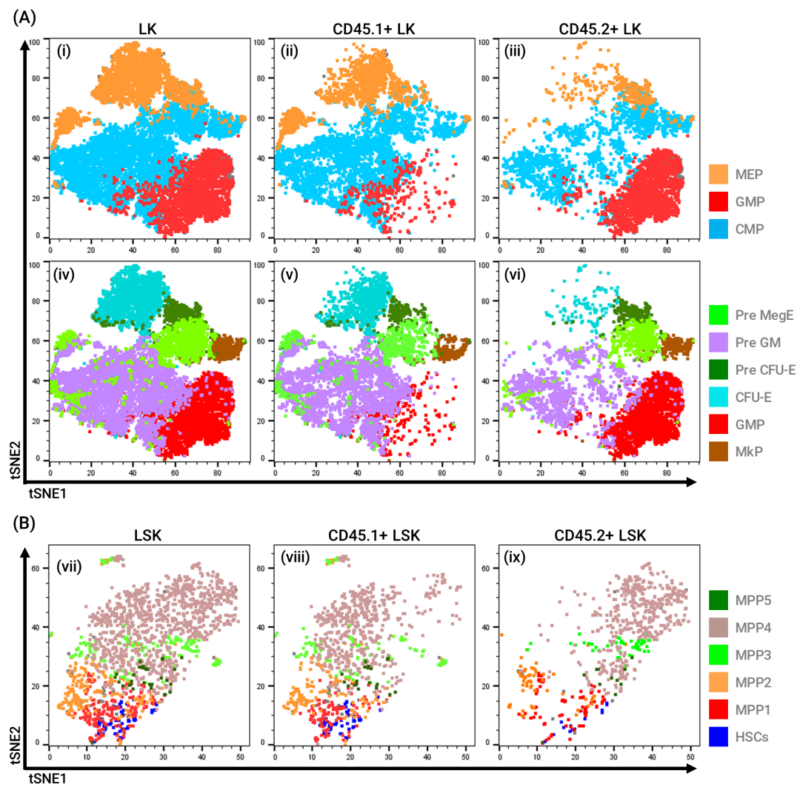
2. High Dimensional Analysis
After removal of debris and adhered cells, identify cell population(e.g. LK and LSK) in FlowJo software following traditional gating strategy for visualization analysis. Further exploration for heterogeneity and distribution shall conduct t-SNE dimension reduction analysis for all surface markers except lineage labeling, viability dye, CD45.1 and CD45.2. Then, divide obtained t-SNE diagram into two groups according to different expression of CD45.1 and CD45.2, comparing cell distribution of different genotype and experimental conditions. Next, map classical cell populations(e.g. HSC, MPP, CMP etc) via manual gating to t-SNE diagram, labeling various populations with different colors. Results show relatively independent distribution of each cell population in the diagram, similarity of HSPC subpopulation and developmental trajectory. Visualization of high dimensional data and biological significance are directly presented.
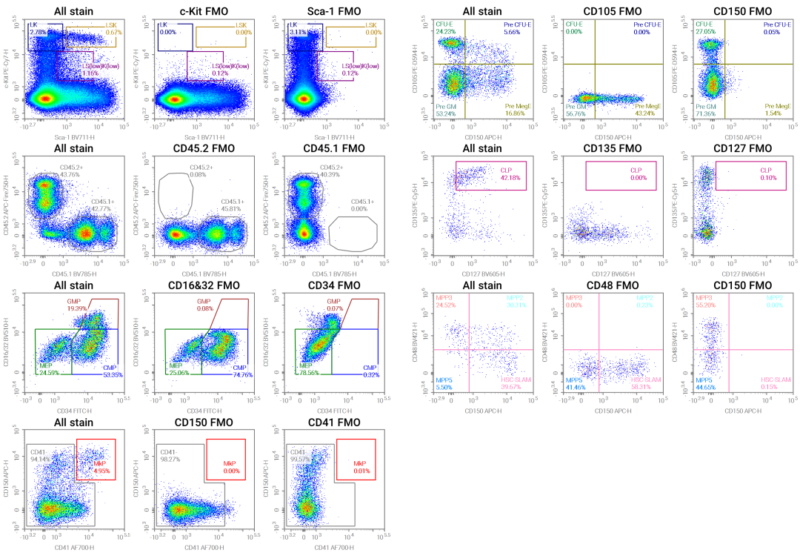
3. FMO Control
FMO control can accurately evaluate recognition ability of all cell surface markers, ensuring accurate distinction between positive and negative cell populations. FMO analysis determines the exact negative boundary and validate fluorescence leakage in experimental conditions won't interfere with effective gating. High resolution ratio of all cell surface markers in consideration of fluorescence diffusion validates reliable gating strategy and accurate experimental data. This step plays an important role in ensuring rigorous and credible flow cytometry analysis.
4. Technical Advantages
Compared with traditional flow cytometer(e.g. BD LSRFortessa), performance of spectrum flow cytometry in identifying rare cell populations(e.g. HSC-LT) and low-abundance cells is better. Meanwhile, full spectrum detection obviously reduces fluorescence compensation errors and improves accuracy of multicolor analysis. Stronger data consistency provides more sensitive and reliable detection platform for complex cell population research.
Roles of multicolor flow cytometry in immunological research are important. This 14-color solution can conduct precise phenotypic analysis for mouse HSPC and deepen understanding among HSCs, MPPs and development of mature blood cells.
| Recommended Products | |||
| Species | Cell Populations | Flow Cytometry Antibody Combination | Cat.No |
| Human | T/B/NK cell populations detection | CD45-PerCP | PCP-30039 |
| CD3-FITC | FITC-30004 | ||
| CD16-PE | PE-30061 | ||
| CD56-PE | PE-30008 | ||
| CD19-APC | APC-30066 | ||
| Human | Thl/Th2 cell populations detection | CD3-PerCP/Cyanine5.5 | PCP55-30004 |
| CD4-FITC | FITC-30005 | ||
| IFN-γ-PE | PE-30053 | ||
| IL4-APC | APC-30043 | ||
| Mouse | Thl/Th2 cell populations detection | CD3-PerCP/Cyanine5.5 | PCP55-30002 |
| CD4-FITC | FITC-30128 | ||
| IFN-γ-PE | PE-30074 | ||
| IL4-APC | APC-30026 | ||
| Human | Treg cell populations detection | CD4-FITC | FITC-30005 |
| CD25-PE | PE-30035 | ||
| CD3-PerCP-Cy5.5 | PCP55-30004 | ||
| CD127-FineTest®647 | F647-30033 | ||
| Mouse | Treg cell populations detection | CD4-FITC | FITC-30128 |
| CD25-APC | APC-30017 | ||
| FOXP3-PE | PE-30111 | ||
REFERENCES
[1]Live MOG-IgG cell-based assay: Comparison across flow cytometers and diagnostic validation on high-sensitivity full spectrum flow cytometry, PMID: 40987090.
[2]OMIP-116: A 39-Color Full Spectrum Flow Cytometric Panel to Deeply Characterize Human Thymopoiesis, PMID: 40693805.