Abstract: Flow cytometry plays an important role in immunological research, analyzing and sorting cell populations rapidly and accurately via proper selection of cell surface markers. Lymphocytes mainly include T/B/NK cell, taking effects in body's immune response respectively. T cell is derived from common lymphoid progenitors. Ordered development in thymus enables entry into peripheral blood and migration to lymphoid tissues(e.g. spleen, lymph nodes). Antigen stimulates differentiation of naive T cell to effector and memory T cell, mediating specific and adaptive immune response. Mature grouping strategy has been widely applied in accurate identification of CD4 T cell subpopulation.
Keywords: CD4 T Cells, Flow Cytometry, T Cell Activation, Foxp3 Intracellular Staining
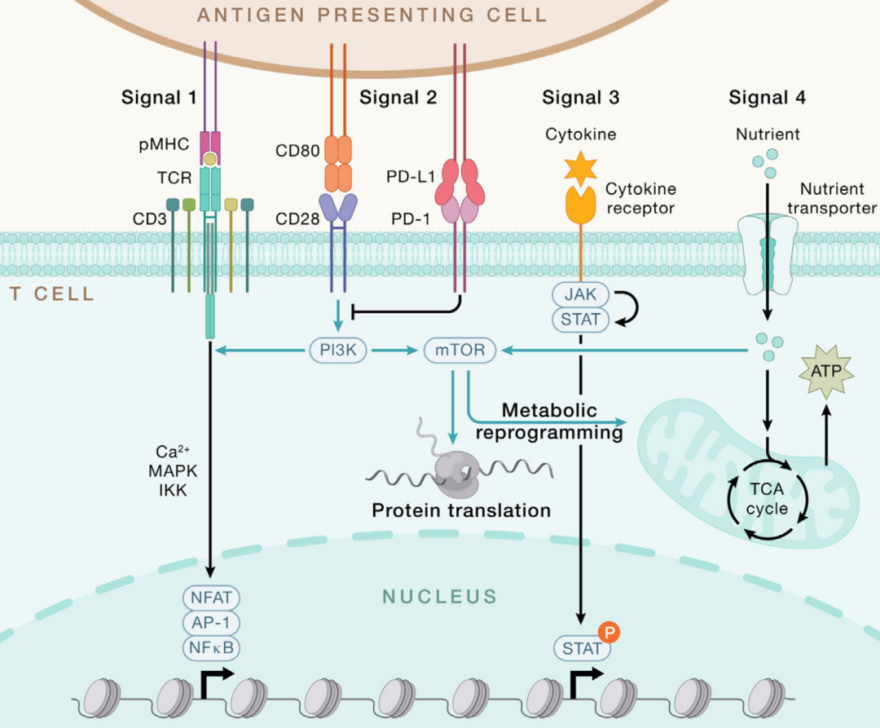
1. Signal 1 2 3 4 for T Cell Activation
Signal 1 is the specific binding between MHC-peptide complex with TCR; Signal 2 is provided by co-stimulatory molecules(e.g. CD28/B7); Signal 3 is cytokine mediated-proliferation and differentiation; Signal 4 is nutrients(e.g. glucose, amino acid), supporting metabolic reprogramming and energy demands. This model breaks through traditional two/three signal model, revealing cell regulation from resting to activation.
2. Typing of Effector CD4+ T Cell
2.1. Materials and Devices
This experiment uses various reagents and consumables, including U shape 96 well, flow cytometry antibodies(e.g. anti-mCD4 FITC, FoxP3, CD16/32), antibodies and cytokines for blocking T cell activation(e.g. anti-CD3/CD28, IL-2, IFNγ, IL-4 etc), RPMI-1640 complete medium and staining buffers(e.g. FBS, PBS, Foxp3). Key devices include flow cytometer, CO₂ incubator, biosafety cabinet, centrifuge and pipette etc, ensuring standardization and reproducibility during separation, stimulation, staining and analysis.
2.2. Experimental Steps
This experiment initializes differentiation of CD4⁺ T cell into different helper T cell subsets via in vitro induction. Then, conduct flow cytometry staining with FoxP3/transcription factor staining buffer. Detailed steps are specified below:
2.2.1. Induction of Cell Differentiation
First, dilute anti-hamster Ig (H+L) to 2 µg/ml with 1x PBS, 100 µl/well coated in U-shape 96-well plate at 4℃ overnight. Next day, purify naive CD4⁺ T cell extracted from mouse spleen, and seed into the coated plate. Add anti-CD3(0.25 µg/ml) and anti-CD28(1 µg/ml) for activation.
Add specific cytokine and blocking antibody according to different subsets: Th1(anti-IL-4 + IL-12 + IL-2), Th2(anti-IFNγ + IL-4 + IL-2), Th9(anti-IFNγ + IL-4 + TGF-β1), Th17(anti-IL-4/IFNγ + IL-6 + TGF-β1) or Treg(anti-IFNγ/IL-4 + TGF-β1). Culture for 3-4 days in RPMI-1640 complete medium.
2.2.2. Foxp3 Intracellular Staining
Collect about 1x10⁵ cell/well. First, conduct surface staining with FACS buffer(2.4G2, anti-CD4 FITC) for 25min at 4℃ in the dark.
Prepare Foxp3 fixation/permeabilization buffer according to ELISA kit manual. Fix for 30-60min at room temperature. After permeabilization, add transcription factor antibodies(e.g. Th1:TBX21; Th2:GATA3; Th9:PU.1/IRF4; Th17:RORγt; Treg:FoxP3). Stain for 25min at 4℃. After sufficient washing, resuspend with 60 µl FACS buffer. Collect data with flow cytometer, and analyze ratio of each CD4⁺ T cell subpopulation and expression level of transcription factors.
3. Results and Analysis
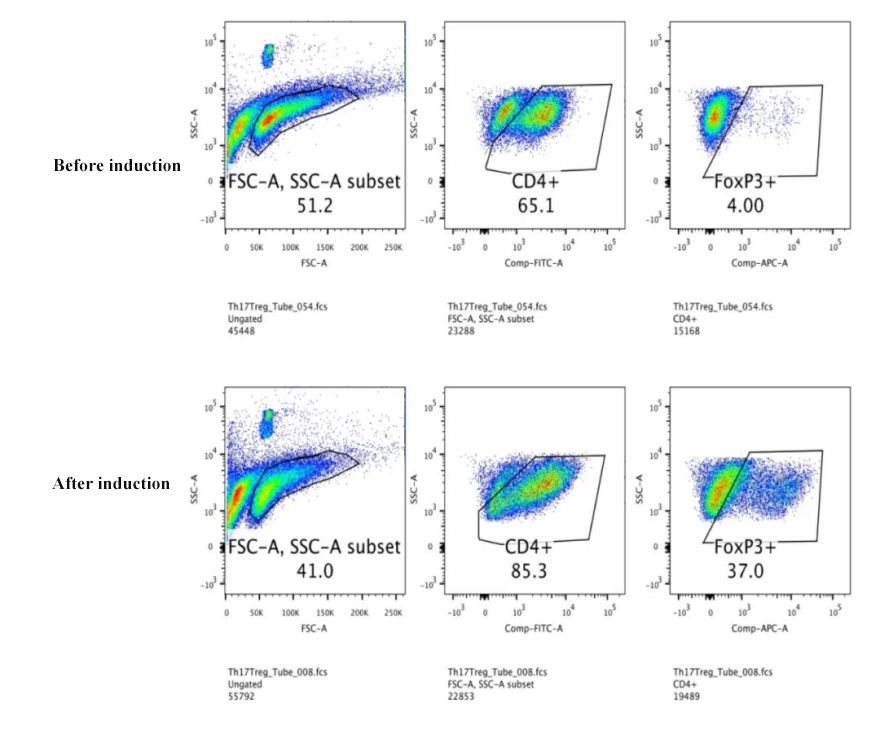
Flow cytometry for Treg cell with Foxp3 staining kit: Before induction, about 4% purified CD4⁺ T cell expresses Foxp3, showing the undifferentiated status; Induction of polarized Treg(including blocking antibodies like TGF-β1, IFN-γ/IL-4) for 4 days enables the increase of Foxp3⁺ cell ratio to 37%. This result validates this inducible system can effectively drive differentiation of naive CD4⁺ T cell to Treg. The transcription factor staining method is also sensitive and reliable.
| Recommended Products | |||
| Species | Cell Populations | Flow Cytometry Antibody Combination | Cat.No |
| Human | T/B/NK cell populations detection | CD45-PerCP | PCP-30039 |
| CD3-FITC | FITC-30004 | ||
| CD16-PE | PE-30061 | ||
| CD56-PE | PE-30008 | ||
| CD19-APC | APC-30066 | ||
| Human | Thl/Th2 cell populations detection | CD3-PerCP/Cyanine5.5 | PCP55-30004 |
| CD4-FITC | FITC-30005 | ||
| IFN-γ-PE | PE-30053 | ||
| IL4-APC | APC-30043 | ||
| Mouse | Thl/Th2 cell populations detection | CD3-PerCP/Cyanine5.5 | PCP55-30002 |
| CD4-FITC | FITC-30128 | ||
| IFN-γ-PE | PE-30074 | ||
| IL4-APC | APC-30026 | ||
| Human | Treg cell populations detection | CD4-FITC | FITC-30005 |
| CD25-PE | PE-30035 | ||
| CD3-PerCP-Cy5.5 | PCP55-30004 | ||
| CD127-FineTest®647 | F647-30033 | ||
| Mouse | Treg cell populations detection | CD4-FITC | FITC-30128 |
| CD25-APC | APC-30017 | ||
| FOXP3-PE | PE-30111 | ||
REFERENCES
[1]B cells drive CD4 T cell immunosenescence and age-associated health decline, PMID: 41616067.
[2]Single-Cell Sequencing Reveals That CD4+ T Cells Eliminate Senescent Prostate Epithelium to Delay Progression of Benign Prostatic Hyperplasia, PMID: 40716051.