Abstract: Accurate quantification of protein concentration plays an important role in a successful molecular biology and biochemical research. Protein is the key biomacromolecule featured with various types, complex structure and different molecular weight. Currently, protein quantification technologies are various with advantages and disadvantages. Thus, selection of calculating protein concentration depends on different experimental requirements.
Keywords: Protein Concentration Determination, Kjeldahl Method, UV Spectrophotometer, Bradford Assay
1. Common Methods for Calculating Protein Concentration
Common methods include Kjeldahl protein determination, UV vis protein concentration determination, Biuret method, Lowry method, Bradford method, BCA method, sulfosalicylic acid, fluorescence-based protein quantification, capillary electrophoresis and immunoassay(e.g. ELISA) etc.
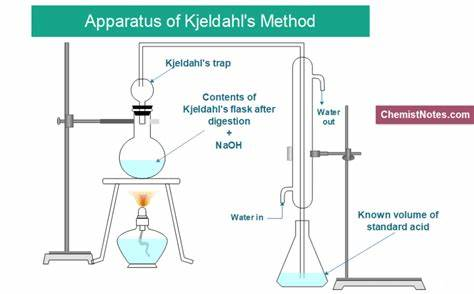
2. Determination of Protein Content by Kjeldahl Method
Kjeldahl protein determination is the classical method for measuring protein content. Protein is the organic compound containing nitrogen. Sample, concentrated sulfuric acid and catalyst are heated together to digest and decompose protein. Carbon and hydrogen are oxidized to carbon dioxide and water for effusion. Meanwhile, organic nitrogen in the sample is converted to ammonia. Ammonia reacts with sulphuric acid to form ammonium sulfate. Then, addition of alkaline distills and release ammonium. Ammonia is absorbed by boric acid solution. Finally, absorbing solution is titrated with standard sulfuric or hydrochloric acid solution. Protein content in the sample can be calculated based on acid consumption multiplied by conversion coefficient(default value: 6.25, 6.38 for dairy products).
Features: Nitrogen content of proteins is about 16% (i.e. 1g nitrogen = 6.25g protein). Thus, nitrogen content multiplied by 6.25 is the relevant protein content.
Advantages: Wide detection range, suitable for all protein analyses; easy operation; improved micro-Kjeldahl method can measure low concentration of protein.
Disadvantages: poor accuracy - the coefficient 6.25 is based on the average nitrogen content. The nitrogen content of different proteins is also different, leading to variable results.
Experimental Steps:
① Sample Preparation: weigh sample and add catalyst and concentrated sulfuric acid.
② Digestion: heat till the solution turns clear blue-green, then cool.
③ Distillation: transfer digestive solution to distillation device, add sodium hydroxide; distill and collect ammonia into boric acid solution.
④ Titration: titrate with standard hydrochloric acid, and record the volume.
⑤ Calculation: calculate the nitrogen content according to titration results, and then convert to protein content.
Notes: safe operation to ensure complete digestion and accurate weighing.
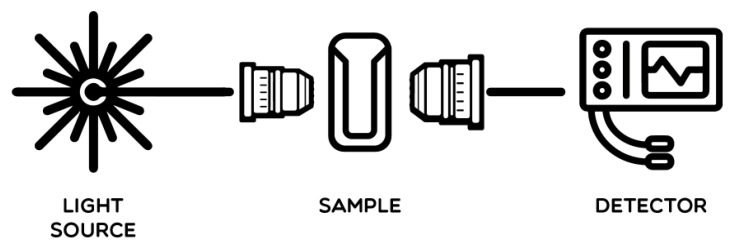
3. Determination of Protein Concentration by UV Spectrophotometer
Tyrosine, phenylalanine and benzene ring of tryptophane residues in the protein molecule have conjugated double bonds, which can absorb ultraviolet at 280nm. Absorbance is proportionate to protein content. Besides, absorbance of protein at 238nm is relevant to the number of peptide bond. Based on Beer-Lambert law, absorbance A is linear to extinction coefficient, protein concentration C and optical path length I: A=E•C•l. Thus, protein concentration can be calculated via measuring absorbance.
Advantages: simple and rapid, no sample consumption, recyclable sample after measurement.
Disadvantages: poor generality, different content of tyrosine and tryptophan causes measurement error, purified protein is required for reference; slightly non-linear standard curve can’t completely follow Beer-Lambert law; Besides, if the sample contains disruptors (e.g. purine, pyrimidine or nucleic acid), results may be affected. Extinction coefficient of proteins depends on different sequences and should be tested in advance to ensure the detection accuracy. Besides, pH value should be consistent to avoid affecting absorption peak.
Experimental Steps:
① Add the protein solution into the cuvette. Set blank control with dissolvant(water or buffer);
② Read absorbance A280 at 280nm via ultraviolet spectrophotometer;
③ Calculate protein concentration according to absorbance and molar extinction coefficient.
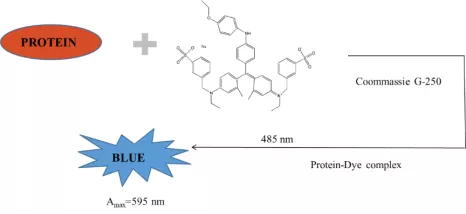
4. Bradford Assay for Determining Protein Concentration
In acidic solution, Coomassie brilliant blue G250 binds with basic amino acids(e.g. arginine) and aromatic amino acids of the protein, enabling the shift of maximum absorption peak and colour from 488nm(brown-red) to 595nm(blue) respectively. The amount of dye bound on the protein is proportionate to positive charge of the protein. The colour depth shows higher or lower protein concentration. Thus, this method can be applied in the quantitative protein analysis.
Features: Since dyes mainly bind with arginine and aromatic amino acids, different protein content may cause measurement deviation. Besides, Van der Waals force and hydrophobic interaction can affect binding. This method is not interfered by most chemical substances(e.g. K+, Na+, EDTA). But high concentration of detergents can affect results(e.g. SDS, Triton X-100).
Advantages: High sensitivity, rapid and simple, less disruptors;
Disadvantages: Measurement deviation for different proteins exist. Some substances are still interfered. Standard curve is slightly non-linear. Concentration should be detected via standard curve.
Experimental Steps:
① Prepare 16 tubes, one for blank control, three for unknown samples. Add 1.0 mg/ml standard protein solution into rest tubes sequentially, following the volume 0, 0.01, 0.02, 0.04, 0.06, 0.08, 0.1 ml. Add 0.1 ml deionized water and 5.0 ml Coomassie brilliant blue G250 reagent by gently mixing. Add unknown samples into new tube.
② After 2-5min, measure the absorbance A595 at 595nm with cuvette. Set the 1st tune as blank control.
③ Plot standard curve to check protein content in unknown samples.
5. Quantification of Protein Concentration
Protein concentration measurement plays an important role in biochemical research. Accurate data guides scientific discovery. Different detection methods have advantages and disadvantages. Choose suitable method according to sample characteristics. During the experiment, pay attention to standard curve preparation, sample dilution ratio and removal of disruptors to ensure accurate and reliable results.
6. Recommended Products
| Cat.No | Product Name |
| P9321 | Recombinant Mouse GM-CSF |
| P4140 | Recombinant Mouse RANKL |
| P1746 | Recombinant Human CTBP2 |
| P1238 | Recombinant Human SESN2 |
| P0010 | Recombinant Human PCT |
| P0852 | Recombinant Human EXT2 Protein |
| P1062 | Recombinant Human DLG4 Protein |
| P1316 | Recombinant Human GP73 Protein |
| P1777 | Recombinant Human FGF4 Protein |
| P2334 | Recombinant Human ATR Protein |
| P2481 | Recombinant Human FBXO22 Protein |
REFERENCES
[1] Associations between genetically predicted concentrations of plasma proteins and the risk of prostate cancer, PMID: 39068416.
[2] Impact of arginine addition on protein concentration via ultrafiltration, PMID: 40112936.