Abstract: After data collection, scientific gating strategy for flow cytometry analysis is required to recognize abnormal cell population in the sample. Data analysis include single and multi-parameter analysis. Important roles of gating in selecting target cell population can remove interference. Accurate identification of cellular phenotype and function provides reliable evidence for disease diagnosis and evaluation.
Keywords: Flow Cytometry Gating, Flow Cytometry Analysis, FSC, SSC
1. Common Types of Gating
1.1. FSC and SSC in Flow Cytometry
Construct two-dimensional graph via scattering light signal. Gating depends on cell size and internal complexity, preliminarily distinguishing different cell population. Gating is the basic step for screening target cells during flow cytometry analysis.
1.2. FSC/SSC and Fluorescence
Gating via FSC/SSC and fluorescence can accurately distinguish cell subpopulations with similar phenotype, based on physical property of cells and molecular markers. Specificity and accuracy of flow cytometry analysis are improved.
2. Underlying Logic of Gating
2.1. Understanding Flow Cytometry Results
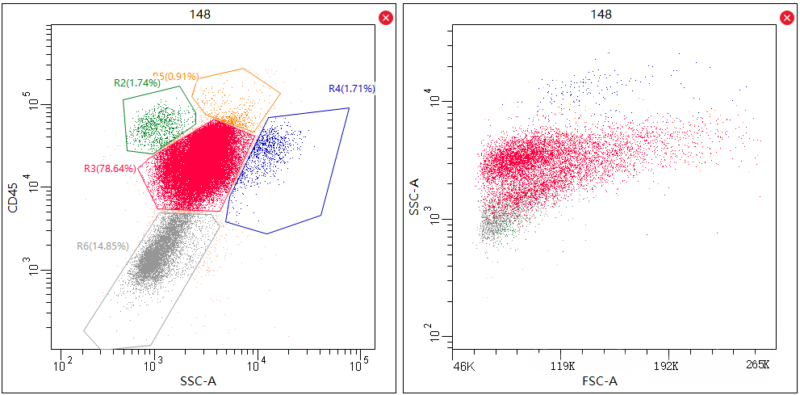
Flow cytometry data analysis is based on graph interpretation. Single-parameter histogram shows cellular distribution of a signal(e.g. fluorescence or scattered light ), reflecting expression and labelling level. Two-parameter scatter diagram or density plot can synchronously show multiple data, e.g. FSC(cell size) and SSC(internal complexity). Distribution of different cell populations is specific due to various physical properties, e.g. Different regions of lymphocyte, monocytes and neutrophils provide basis for accurate gating.
2.2. Setting Control Group for Gating
Roles of setting control group are very important for gating, ensuring data accuracy. Isotype control and detection antibody are identical in species, subtype and fluorescence labeling, but unbound with the target antigen. Recognition of Fc receptor mediated non-specific binding can remove background interference. Negative control determines positive cut-off value of fluorescence, distinguishing true signal and background noise. Deficiency of control can cause gating misjudgement and greatly affect analytical reliability.
3. Important Gating Steps
3.1. Screening of Invalid Items
Debris and dead cells during cell preparation usually aggregate on the bottom-left of FSC/SSC diagram(low FSC/SSC region). Regulation of FSC cut-off value can initially remove debris. Viability dyes(e.g. DAPI or 7-AAD) can specifically label dead cells, facilitating gating in fluorescence channel. During intracellular staining, fixation/permeabilization may change. Careful analysis for FSC/SSC change avoid misjudgement of cell grouping.
3.2. Anchoring of Target Cell Population
Take PBMC analysis for example: Distribution of different cells in FSC/SSC diagram is varied. Lymphocytes are distributed in the middle and left of the diagram due to moderate volume and simple structure. Monocytes are bigger in FSC diagram and higher in SSC. Target cell population can be selected via polygon or ellipse, removing interferences induced by neutrophils and cell aggregates etc. Volume screening plays an important role in gating, providing an approach for analysis of fluorescence labeling. Misoperations can easily cause misjudgement and wrong conclusion.
3.3. Parametric Analysis via Fluorescence Labeling
Singal-parameter analysis recognizes positive features of cells via histogram. E.g. Dual peaks appear after staining CD4. Positive cells are on the right. Then, isotype control is required. The signal should completely cover negative peak. Removal of interference induced by non-specific binding can ensure accurate positive judgment. Two-parameter analysis achieves precise localization via density plots or scatter diagram. E.g. Comprehensive analysis of CD3 and CD19 can clearly distinguish subpopulations like T cells(CD3+CD19-) and B cells(CD3-CD19+) via quadru-quadrant. Two-dimensional strategy can effectively analyze complex samples to avoid cellular confusion. This method employs accurate quantification of cell subpopulation during flow cytometry analysis.
4. Notes
Position of gating depends on fluorescence expression intensity of samples and can be flexibly regulated via FSC/SSC features. In multi-color flow cytometry analysis, emission spectra of different fluoresceins may be overlapped. Accurate fluorescence compensation is required. Insufficient or improper compensation can cause signal crosstalk. One of channels may be contaminated by other fluorescence. Interfered recognition of cell population causes incorrect gating and affects analysis for accurate results.
| Recommended Products | |||
| Species | Cell Populations | Flow Cytometry Antibody Combination | Cat.No |
| Human | T/B/NK cell populations detection | CD45-PerCP | PCP-30039 |
| CD3-FITC | FITC-30004 | ||
| CD16-PE | PE-30061 | ||
| CD56-PE | PE-30008 | ||
| CD19-APC | APC-30066 | ||
| Human | Thl/Th2 cell populations detection | CD3-PerCP/Cyanine5.5 | PCP55-30004 |
| CD4-FITC | FITC-30005 | ||
| IFN-γ-PE | PE-30053 | ||
| IL4-APC | APC-30043 | ||
| Mouse | Thl/Th2 cell populations detection | CD3-PerCP/Cyanine5.5 | PCP55-30002 |
| CD4-FITC | FITC-30128 | ||
| IFN-γ-PE | PE-30074 | ||
| IL4-APC | APC-30026 | ||
| Human | Treg cell populations detection | CD4-FITC | FITC-30005 |
| CD25-PE | PE-30035 | ||
| CD3-PerCP-Cy5.5 | PCP55-30004 | ||
| CD127-FineTest®647 | F647-30033 | ||
| Mouse | Treg cell populations detection | CD4-FITC | FITC-30128 |
| CD25-APC | APC-30017 | ||
| FOXP3-PE | PE-30111 | ||
REFERENCES
[1]Evaluation of a cost-effective gating strategy for CD4+ T lymphocyte enumeration in HIV-infected individuals via flow cytometry, PMID: 40253874.
[2]Flow Cytometric Challenges in Plasmacytoid Dendritic Cell (pDC) Identification: Limitation of BDCA-4 (CD304)-Based Gating, PMID: 41303461.