Abstract: Autofluorescence is the natural fluorescence produced by irradiation of specific molecules in cells and tissues at specific wavelength. Common endogenous fluorescent substances are NADH, Flavin coenzyme, vitamin and proteins containing aromatic amino acids. Autofluorescence also occurs in extracellular collagens, lipofuscin, plants and alga(e.g. chlorophyll, flavone and carotenoids). Interference with signal detection in flow cytometry exists as well. Differences in various cells increase difficulty of data analysis.
Keywords: Autofluorescence, Flow Cytometry, Signal Detection, Data Analysis
1. Function and Effects of Autofluorescence
1.1. Positive Effects
Autofluorescence is the intracellular marker, and can reflect metabolism and physiological state of cells without any additional dye. E.g. contents and distribution of fluorescent substances change with metabolic alterations in cells. The increase of autofluorescence has been recognized during cell senescence, found in mesenchymal stem cells, nerve cells, skin cells and cancer cells. Researches on cell function and status can obtain important information.
1.2. Negative Effects
Autofluorescence in flow cytometry can help to recognize cell population, but also interfere with fluorescent marker detection(especially dyes with weaker signal.). Natural luminescence of various intracellular compounds at 400-600nm wavelength reduces signal resolution and sensitivity. Detection accuracy for common dyes is affected.
2. Spectral Flow Cytometry
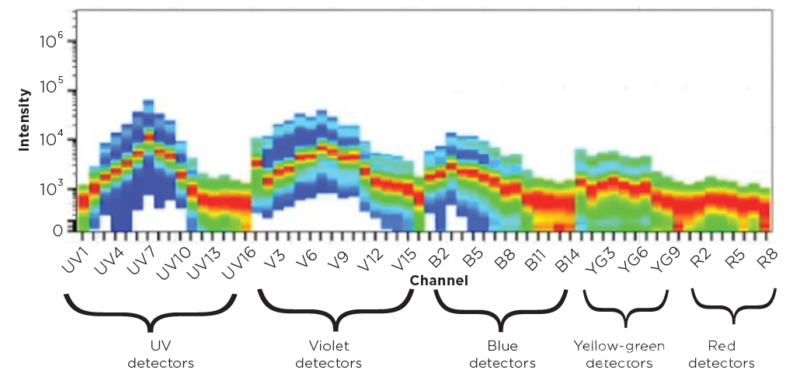
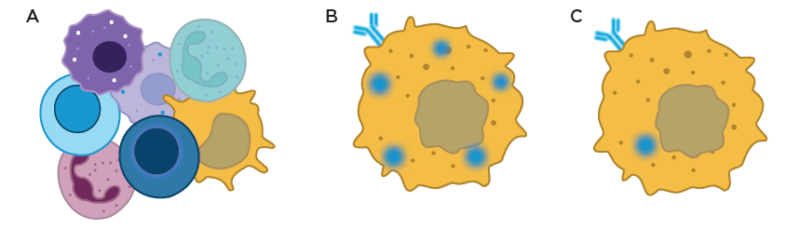
Spectral flow cytometry generates unique spectral fingerprint through capturing full emission spectrum of fluorescent molecules over a wide range of wavelengths, facilitating recognition and unmixing of multi-color signal. This spectrum acquisition technique improves analytical ability. Autofluorescence(AF) still faces three problems: first, AF shows heterogeneity among different types of cells. Differences of spectral characteristics are obvious; Second, AF signal with high background easily cover weak fluorescent signal of low-abundance target. Detection sensitivity is affected; Finally, AF is overlapped with emission spectrum of fluorescent markers, increasing the risk of false positive and difficulty in result analysis.
3. Optimization Process
Suggestions for autofluorescence in common flow cytometry: First, use formaldehyde as fixative. Glutaric dialdehyde produces strong autofluorescence. Formaldehyde(0.01%, 10-15min) together with Triton or NP-40 for permeabilization is suitable for nuclear antigen staining. Ethanol has better permeabilization effects and longer preservation time. But stronger autofluorescence affects surface site detection. Second, fluoresceins should choose emission wavelength above 600nm to avoid autofluorescence peak(350-550nm). High brightness of fluoresceins can reduce interference. Finally, proper control should be used to correct autofluorescence, overlapped spectrum and non-specific binding, ensuring data accuracy.
4. Management Strategy
Unique autofluorescence spectrum of unstained cells in simple samples can be used as endogenous markers. Design detection method to remove interference and analyze low-abundance target accurately. Heterogeneous samples require for establishing various AF spectrum libraries. Capture heteromorphosis with multi-sample unstained control. CytoFLEX mosaic supports multi-channel collection to help modeling. Microsphere or cell control can optimize analysis and eliminate AF influence via target dye and spectrum. Improve signal resolution and data accuracy via gating, dimensionality reduction and advanced algorithms(e.g. Poisson hybrid algorithm for CytoFLEX mosaic).
| Recommended Products | |||
| Species | Cell Populations | Flow Cytometry Antibody Combination | Cat.No |
| Human | T/B/NK cell populations detection | CD45-PerCP | PCP-30039 |
| CD3-FITC | FITC-30004 | ||
| CD16-PE | PE-30061 | ||
| CD56-PE | PE-30008 | ||
| CD19-APC | APC-30066 | ||
| Human | Thl/Th2 cell populations detection | CD3-PerCP/Cyanine5.5 | PCP55-30004 |
| CD4-FITC | FITC-30005 | ||
| IFN-γ-PE | PE-30053 | ||
| IL4-APC | APC-30043 | ||
| Mouse | Thl/Th2 cell populations detection | CD3-PerCP/Cyanine5.5 | PCP55-30002 |
| CD4-FITC | FITC-30128 | ||
| IFN-γ-PE | PE-30074 | ||
| IL4-APC | APC-30026 | ||
| Human | Treg cell populations detection | CD4-FITC | FITC-30005 |
| CD25-PE | PE-30035 | ||
| CD3-PerCP-Cy5.5 | PCP55-30004 | ||
| CD127-FineTest®647 | F647-30033 | ||
| Mouse | Treg cell populations detection | CD4-FITC | FITC-30128 |
| CD25-APC | APC-30017 | ||
| FOXP3-PE | PE-30111 | ||
REFERENCES
[1]Protocol for autofluorescence-driven isolation of human peripheral blood eosinophils, PMID: 39565692.
[2]Utility of Parathyroid Autofluorescence in Differentiating Parathyroid Pathology, PMID: 40044447.