Abstract: Fluorescence spectral overlap usually leads to signal crosstalk in multicolor microscope and flow cytometry, referred to as fluorescence leakage. Fluorescence compensation is the key step in multicolor flow cytometry, and can ensure data accuracy, reliability and authenticity via correcting spectral overlap among different dyes and removing signal interference.
Keywords: Fluorescence Compensation, Multicolor Flow Cytometry, Spectral Overlap, Signal Interference
1. Principle of Fluorescence Compensation
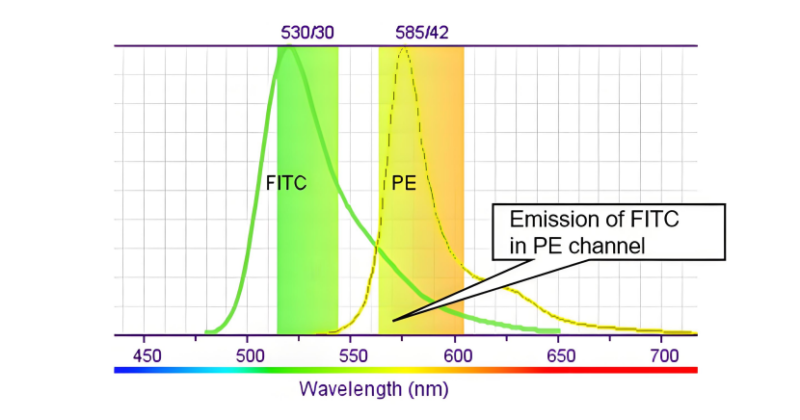
Flow cytometers detect signal of fluorescent-labeled cells via multiple fluorescent channels. Due to overlapped emission spectrum, the fluorescence of a certain dye may be mistakenly captured by other channels. E.g. When sharing FITC(emission peak: about 525nm) and PE(emission peak: about 575nm), long-wavelength emission from FITC may enter PE channel. Short-wavelength emission from PE may be detected by FITC channel. Thus, signal interference occurs.
2. Roles of Fluorescence Compensation
2.1. Correction of Spectral Overlap
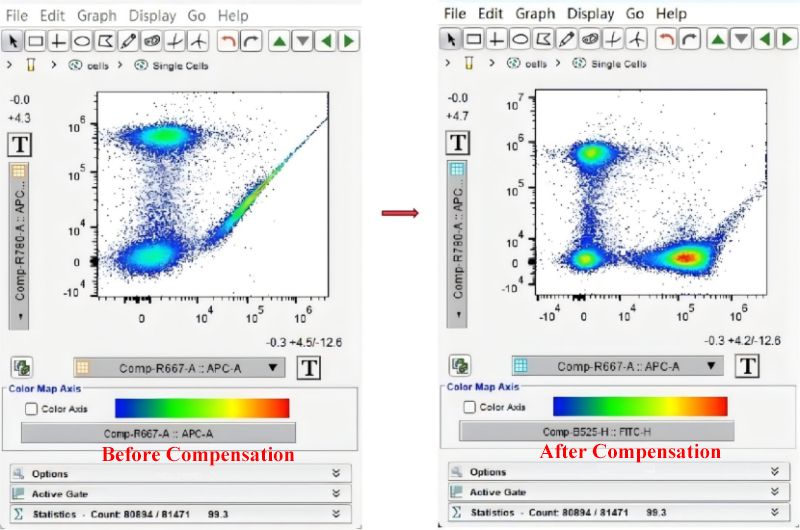
Spectral overlap can cause misjudged signal. E.g. For FITC labeled cells, PE channel may detect false positive signal. Double positive cells appear. Compensation removes overlapped interference from each channel signal and restores the true signal via mathematical calculation.
2.2. Accuracy of Multi-parameter Analysis
In three and multi-color flow cytometry, spectral overlap is more complex. Compensation is the basis for differentiating cell subpopulation. E.g. during analysis of immune cells, insufficient compensation for CD4(FITC) and CD8(PE) can cause deviation of cell counting and affect analysis of T cell subpopulation.
2.3. Optimization of Data Quality and Reproducibility
Uncompensated data usually show high background and adhered cell population. Compensated negative cell population is more aggregated. Boundary among positive and negative population is clear. Data quality and reproducibility are improved.
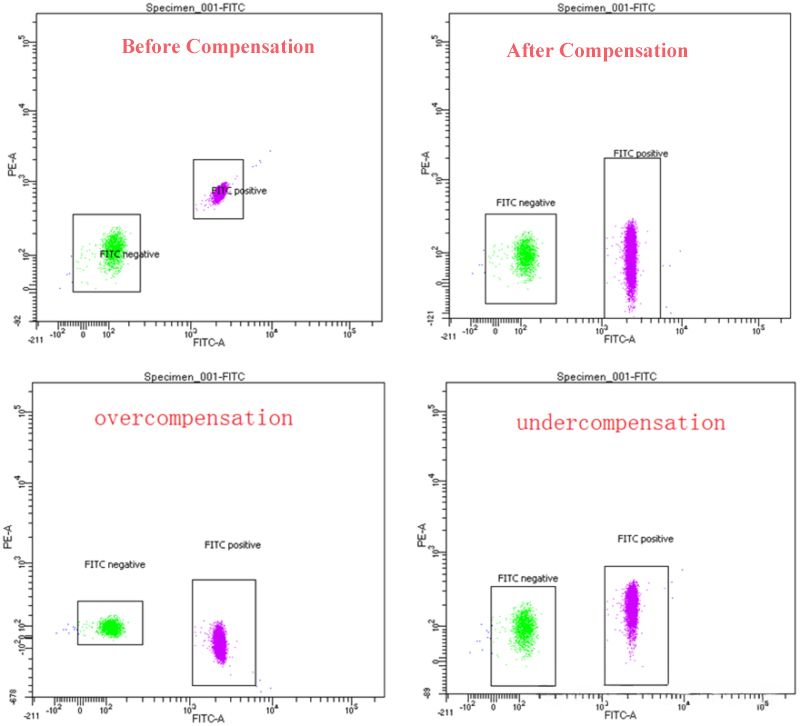
Improper compensation can generate new errors: undercompensated negative cells in unlabeled channel show signal tailing. Boundary of cell population is vague. False positive increases. Overcompensation excessively removes interference. Positive cell signal is underestimated. Left shift of negative population or broken positive population affects data accuracy and analysis of results.
3. Operation of Fluorescence Compensation
Avoidance of overcompensation and undercompensation depends on dynamic regulation of compensation value. First, set sample control with single staining(e.g. only labeled with FITC or PE). Observe flow cytometry chart: signal of FITC single stained cells in PE channel shows undercompensation, and should increase the compensation value of FITC→PE; Overcompensation induced decrease of FITC signal should reduce compensation of other channels for FITC. Second, real-time observation of cell population distribution and proper adjustment of parameters can use compensation matrix and visualization tools in flow cytometry analysis software(e.g. FlowJo, FCS Express). Lower than 5% of adjustment range can ensure data accuracy and reliability.
4. Notes
Fluorescence compensation for each dye should prepare single staining control tube and unstained control. Voltage during sample collection and compensation should be the same. Otherwise, compensation values are varied. Fluorescent dye for compensation control should be the same as sample instead of similar dyes. Autofluorescence among negative and positive cell populations should be consistent. Positive signal intensity of monochrome compensation tube shouldn't be lower than sample, ensuring accuracy of compensation calculation.
The core of fluorescence compensation is balance among removal of interference and reservation of real signal. Parameters can be optimized via single staining control and real-time monitoring. Accuracy of multicolor flow cytometry determines the reliability of results.
| Recommended Products | |||
| Species | Cell Populations | Flow Cytometry Antibody Combination | Cat.No |
| Human | T/B/NK cell populations detection | CD45-PerCP | PCP-30039 |
| CD3-FITC | FITC-30004 | ||
| CD16-PE | PE-30061 | ||
| CD56-PE | PE-30008 | ||
| CD19-APC | APC-30066 | ||
| Human | Thl/Th2 cell populations detection | CD3-PerCP/Cyanine5.5 | PCP55-30004 |
| CD4-FITC | FITC-30005 | ||
| IFN-γ-PE | PE-30053 | ||
| IL4-APC | APC-30043 | ||
| Mouse | Thl/Th2 cell populations detection | CD3-PerCP/Cyanine5.5 | PCP55-30002 |
| CD4-FITC | FITC-30128 | ||
| IFN-γ-PE | PE-30074 | ||
| IL4-APC | APC-30026 | ||
| Human | Treg cell populations detection | CD4-FITC | FITC-30005 |
| CD25-PE | PE-30035 | ||
| CD3-PerCP-Cy5.5 | PCP55-30004 | ||
| CD127-FineTest®647 | F647-30033 | ||
| Mouse | Treg cell populations detection | CD4-FITC | FITC-30128 |
| CD25-APC | APC-30017 | ||
| FOXP3-PE | PE-30111 | ||
REFERENCES
[1]Highly Efficient Calibration-Free Color Compensation Algorithm for Imaging Flow Cytometry, PMID: 40202100.
[2]AutoSpill is a principled framework that simplifies the analysis of multichromatic flow cytometry data, PMID: 34001872.