Abstract: Elisa standard curve analysis for sample concentration is completed by data of lyophilized standard. Accurate statistical analysis of Elisa results depends on whether the standard curve can restore the kinetic process of antigens and antibodies. According to the scientific analytical method, if singularity or stain exists, using linear analysis directly is unsuitable. It's suggested to select several points for Elisa standard curve calculation. Meanwhile, log-log linearity or four-parameter curve is applicable as well.
Keywords: Elisa Standard Curve Fitting, Elisa Statistical Analysis, Regression Analysis, Regression Equation, Elisa Kit
1. Elisa Standard Curve Protocol
Usually, the standard curve can be fitted according to methods recommended by instructions. It can be drawn by the software or manual operation. The standard curve is presented in "s-shape". Both ends tend to be horizontal. The middle part tends to be linear and is the good measurement range. When the content of lyophilized standard is higher than the content of coated antibodies binding, the lyophilized standard has been saturated. The OD value still remains the same by increasing the content of lyophilized standard. Hence, when the concentration of lyophilized standard reaches a certain value, the curve tends to be horizontal.
2. Seven Elisa Standard Curve Equations
2.1. Linear Regression
Linear regression is the easiest regression model and is the basic regression analytical method for curve fitting. All testing points are fitted into a line.
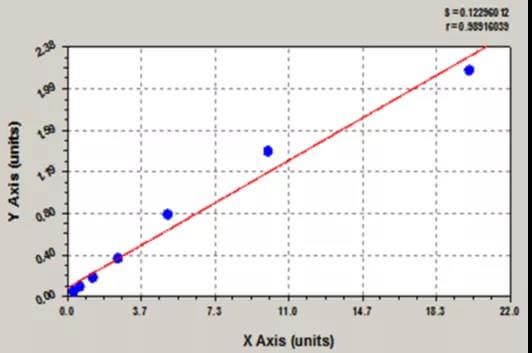
Figure 1. Fitting function equation: y=a+bx
2.2. Quadratic Polynomial Regression Equation
Quadratic polynomial is shown in the form of parabola which opens upward or downward. In many ELISA tests, either ascending or descending order of quadratic polynomial is fitted. Due to features of the curve, the same concentration value may differently appear in the curve: no relevant OD value, one OD value, or two OD values. Thus, when using quadratic polynomial for fitting, the range of selected value should entirely fall in the ascending or descending curve. Otherwise, the good correlation coefficient is probably inconsistent with the actual value.
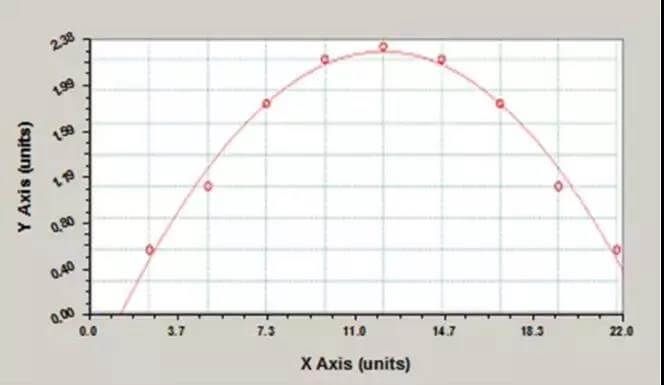
Figure 2. Fitting function equation: y = a + b x + c x2
2.3. Cubic Polynomial Regression Equation
Cubic polynomial is presented in inverted "s-shape". If the test result just falls in the ascending or descending curve, the effect is good. However, if the value range is wide, due to the fluctuation of the curvature, the simulation of cubic polynomial may not be good. Like quadratic equations, both the correlation coefficient of the curve and the distribution of calculated points should be concerned. Then, the ideal result can be obtained. During calculating values with the software, selectively choose relative concentration or OD value and list the result corresponding with the actual situation instead of listing several results.
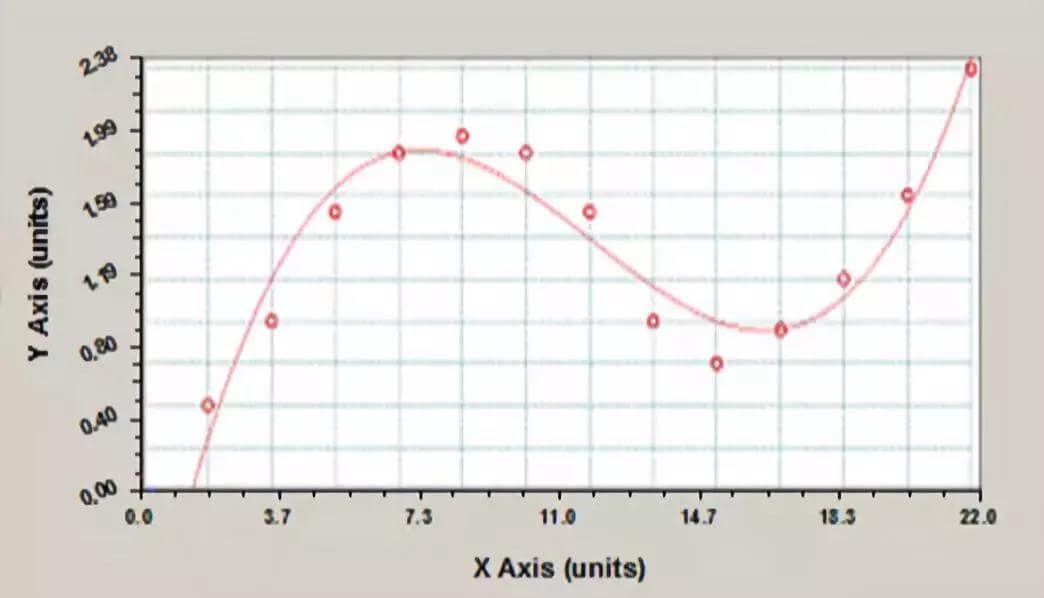
Figure 3. Fitting function equation: y = a + b x + c x2 + d x3
2.4. Semilogarithmic Regression Equation
Semilogarithmic fitting refers to take logarithm of concentration value and make linear regression in appropriate OD value. The ideal result is a line under semilog coordination, showing concentration logarithmically increases or decreases with the related variation of OD values. In other words, the change of concentration is stronger than the variation of OD values. Semilogarithmic fitting is used in ELISA test(Semilogarithm is also used for drawing in EXCEL).
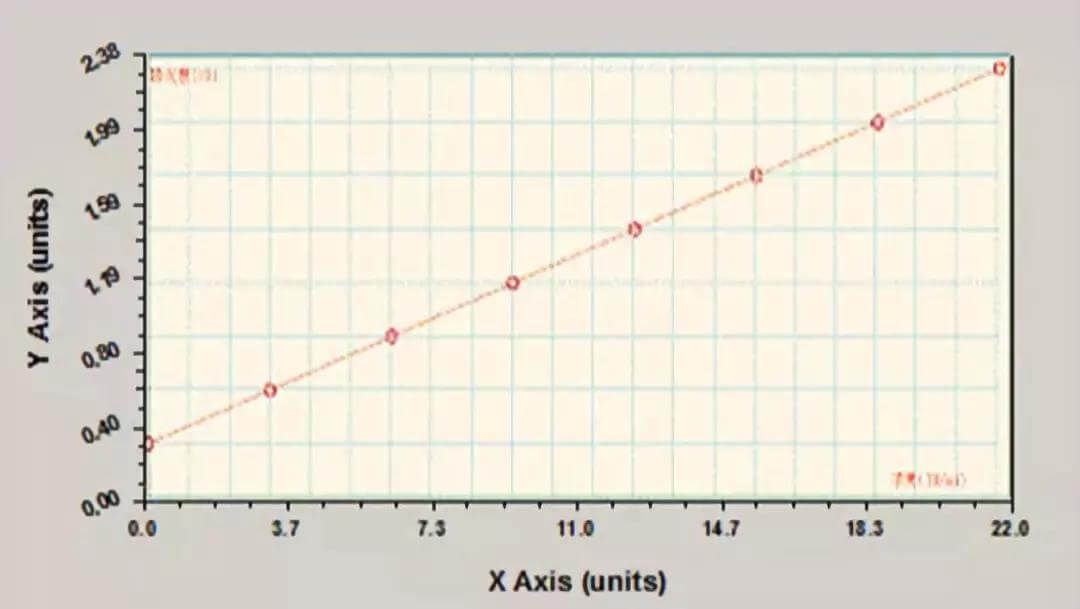
Figure 4. Fitting function equation: y = a lg(x) + b
2.5. Log-Log Regression Equation
Log-Log fitting is similar with semilogarithmic fitting. OD values and relevant concentration values are made by the linear regression and then linear regression is performed.
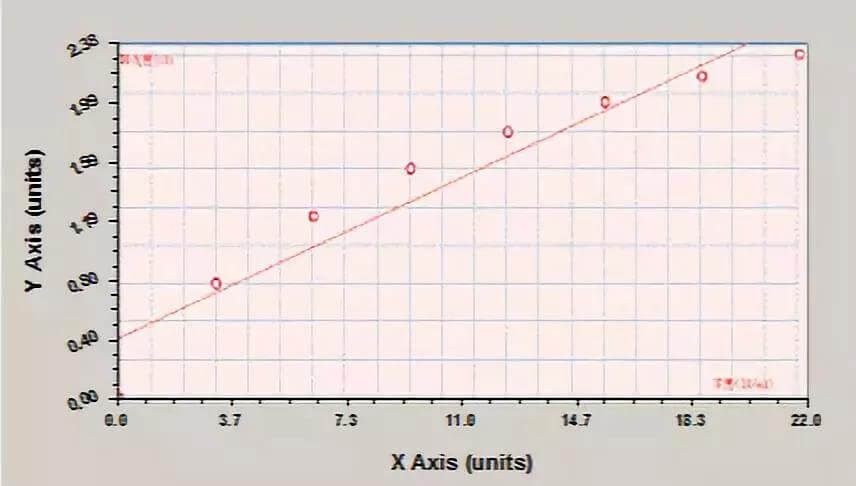
Figure 5. Fitting function equation: lg(y) = a lg(x) + b
2.6. Logit-Log Regression Equation
Logit-log is the model in immunological test and can be applied in competitive method. It is firstly used in RIA and is also applicable in ELISA. Logit transformation comes from the logistic curve in mathematics. In the competitive RIA analysis and ELISA, when competitive reactants are zero, the binding rate is 100%. If the binding rate under a certain concentration is B{B=OD/OD(0)}, logit transformation is taken for B{y=ln[B/(1-B)]}. Then there is a linear relationship between y and the logarithm of concentration. {y = a + b lg(x)} The fitting function equation is lg(y) = a lg(x) + b. The Logit-log linear regression model is obtained, which is usually applied in competitive fitting. Hence, a minimum of OD value tested by zero concentration is required for fitting. The value should be the max value of the reaction(A blank control group is necessary).
2.7. Four Parameter Regression Equation
Fitting function expression of four parameter equation:
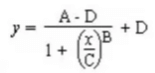
The four parameter can be applied in competitive and sandwich method. The curve shape varies according to different situations: a monotonically increasing or decreasing similar index, logarithm or hyperbola, or a "s-shape" curve. Because index is real number, the X value shouldn't be less than 0. In many cases, it can fit response curves of ELISA and is one of the most widely used models.
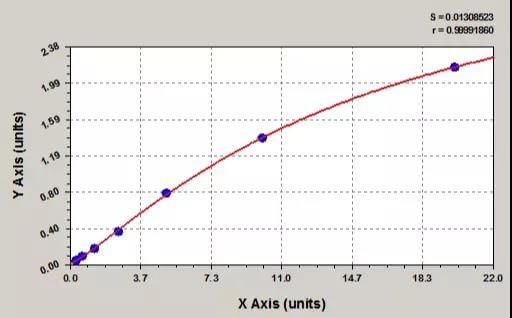
Figure 6. Elisa 4 Parameter Logistic Curve.
3. Conclusion
During the experimental process, to get the most reasonable detection result, the selection of curve fitting model depends on the feature of each experiment. Usually, the trend of standard curve and R value should be considered for choosing a suitable regression equation. Browse a list of FineTest Elisa Kit.
REFERENCES
[1] Updating the ELISA standard curve fitting process to reduce uncertainty in estimated microcystin concentrations, PMID: 30023312.
[2] Comparisons of standard curve-fitting methods to quantitate Neisseria meningitidis group A polysaccharide antibody levels by enzyme-linked immunosorbent assay, PMID: 1909345.