FineTest antibody contributes to the research on single cell gene expression analysis. This secondary antibody is used for igG control.
Publication Details
Article Title: Single-cell transcriptome and translatome dual-omics reveals potential mechanisms of human oocyte maturation
Journal Title: Nature Communications
DOI: 10.1038/s41467-022-32791-2
IF: 17.694
PMID: 36042231
Abstract: The combined use of transcriptome and translatome as indicators of gene expression profiles is usually more accurate than the use of transcriptomes alone, especially in cell types governed by translational regulation, such as mammalian oocytes. Here, we developed a dual-omics methodology that includes both transcriptome and translatome sequencing (T&T-seq) of single-cell oocyte samples, and we used it to characterize the transcriptomes and translatomes during mouse and human oocyte maturation. T&T-seq analysis revealed distinct translational expression patterns between mouse and human oocytes and delineated a sequential gene expression regulation from the cytoplasm to the nucleus during human oocyte maturation. By these means, we also identified a functional role of OOSP2 inducing factor in human oocyte maturation, as human recombinant OOSP2 induced in vitro maturation of human oocytes, which was blocked by anti-OOSP2. Single-oocyte T&T-seq analyses further elucidated that OOSP2 induces specific signaling pathways, including small GTPases, through translational regulation.
Keywords: Oogenesis, Ribosome, Sequencing, Transcription
IgG Control
| FineTest Product | Sample | Species |
| Normal Rabbit IgG Control (FNSA-0106) | Oocytes | Human |
Validated Image
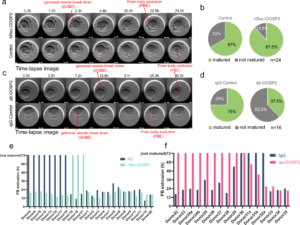
Figure Source: Nat Commun. 2022 Aug 30;13(1):5114. doi: 10.1038/s41467-022-32791-2.
Fig. 6: OOSP2 promote human oocytes maturation in vitro: a Time-lapse image showing the progressive maturation of human GV oocytes in hRec-OOSP2 containing medium (top row) and control medium (bottom row) with indicated time (h). Red arrows indicate the occurrence of GVBD or PBE. b Pie chart showing the maturation rate of hRec-OOSP2 treated oocytes and control oocytes. n = 24 (21 pairs of independent donors, each pair of oocytes was from the same donor. Chi-square = 2.9484, p = 0.08586, Chi-square test). c Time-lapse images showing the progressive maturation of human GV oocytes in antibody against OOSP2 (ab-OOSP2) containing medium (top row) and control medium (ig-Control, bottom row) with indicated time (h). Red arrows indicate the occurrence of GVBD or PBE. d Pie chart shows the maturation rate of ab-OOSP2 treated oocytes and igG control oocytes. n = 16 (14 pairs of independent donors, each pair of oocytes was from the same donor. Chi-square = 4.57143, p = 0.03251, Chi-square test). e PBE duration of each pair of oocytes in hRec-OOSP2 and control oocytes. PBE duration over 72 h is counted as not matured. f PBE duration of each pair of oocytes in ab-OOSP2 and the control oocytes. PBE duration over 72 h is counted as not matured.